On the 12th of December 2019 at 18 o’clock there will be official opening of the exhibition “Experimental Diagramming” at the Architekturmuseum der Technischen Universität Berlin, where some of my recent works will be shown. The exhibition is based on a call for artefacts and aims […]
All posts tagged: data visualization

TU Berlin’s Supply Chain Urbanism Course Insights
Dates: SoSe 2019 Institution: TU Berlin, CHORA: Conscious City Supervision PIV: Agata Kycia (as part of the Design Studio SUPPLY CHAIN URBANISM supervised by prof. Raoul Bunschoten, Moritz Maria Karl and Georg Hubmann) PIV seminar was part of the SUPPLY CHAIN URBANISM design studio: Belt and Road […]
Visibility computation
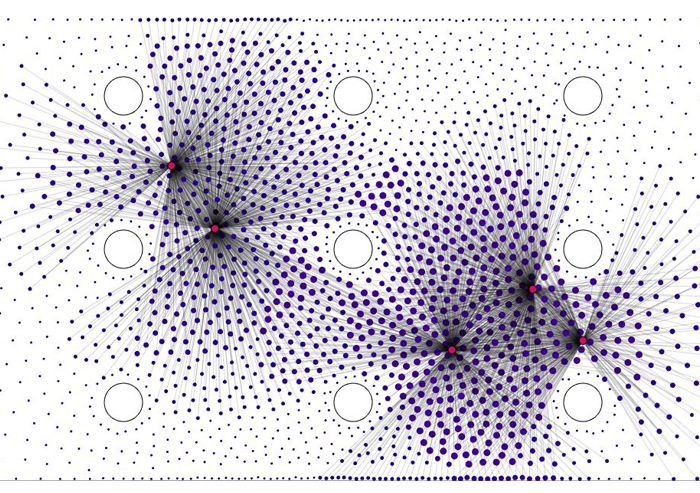
The following study is a visualisation tool aiming to explore the inspirational potential of dynamic diagramming in the conceptual stage of the design process. Developed as Processing application, this dynamic diagram represents visibility patterns in a space with given obstacles. It enables real-time study of […]

Dynamic Diagramming
INTRA MUROS 2012 – DYNAMIC DIAGRAMMING / DATA VISUALISATION IN PROCESSING Location: Fachhochschule Düsseldorf, University of Applied Sciences Dates: November 2012 Tutors: Moritz Fleischmann, Agata Kycia Student: Maryvonne Wellen Description: Open source programming languages (such as Processing), in addition to the usual functionality for data […]

Visualization techniques using image data
Ongoing experiments with image-based data visualisation techniques. Inspiration: Generative Gestaltung book. Case study_01: the following modules replace pixels of an image based on their RGB data
