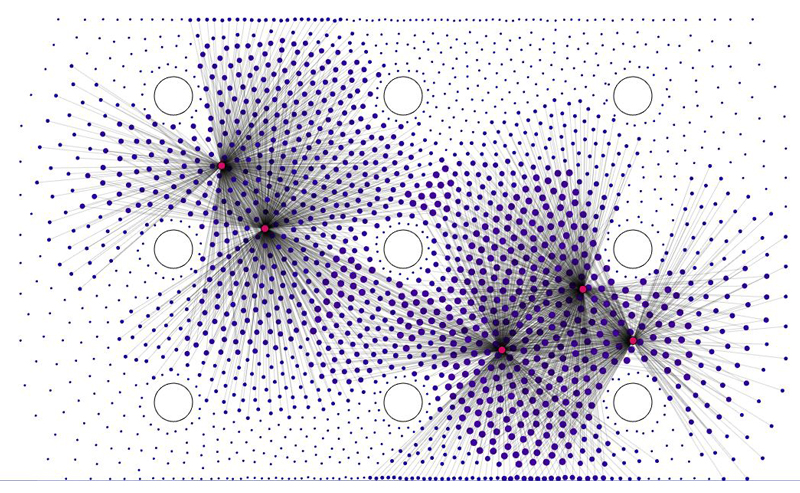
The following study is a visualisation tool aiming to explore the inspirational potential of dynamic diagramming in the conceptual stage of the design process. Developed as Processing application, this dynamic diagram represents visibility patterns in a space with given obstacles. It enables real-time study of isovists and multiple orientation points in a 2D space.
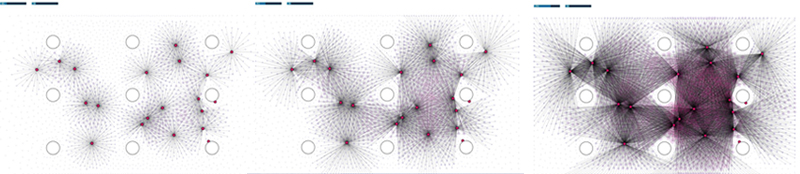
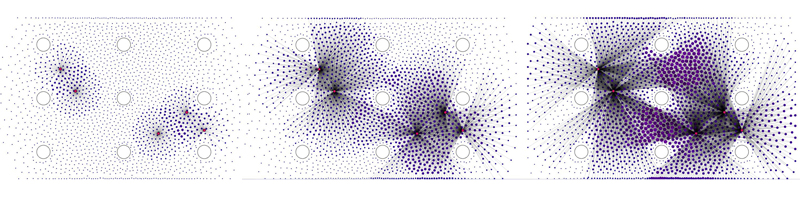 This diagramming technique shows density of the orientation points given certain visibility field, informing the designer from which areas the chosen points are most and least visible; allowing to interactively reconfigure the distribution.
Analysis process
The tool was developed based on spring modelling principles in Processing with the use of the following libraries: generative design, controlP5. Given a set of obstacles imported from a txt.file, the analysis grid with chosen resolution is being distributed. As the next step, a series of strategic orientation points is being generated, serving as a base for the isovist calculation. The amount of orientation points as well as the range of a visual field can be controlled through given interface. The color code and size of the grid points corresponds to the amount of orientation points visible from that specific location.
 [technical support: Maximilian Thumfart, Kacper Rybczynski, Moritz Fleischmann]
